Understand heat
Atlas of Asia’s heat
Where, and when, heat has changed what places do. Drag the timeline, or press play, to watch heatwaves arrive and the plans that came after.
How to read this
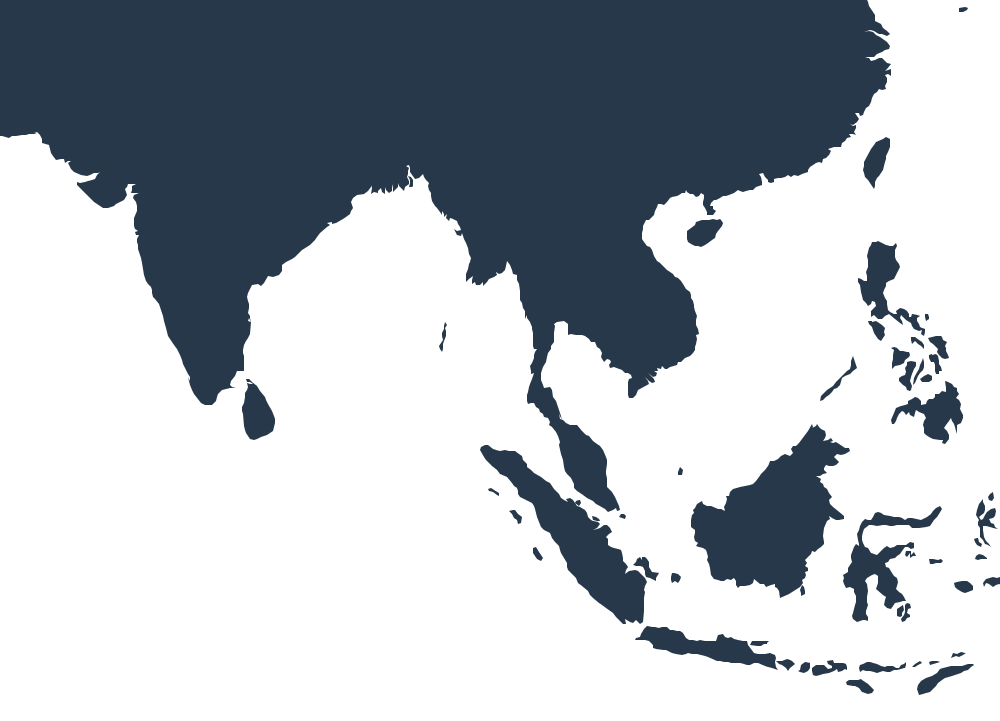
- Approximate placesHeatwaves are drawn as areas around where they were worst; the map has no borders and is not a political map.
- A milestone is a step, not a scoreEach marks something done, with its source. It says nothing about how well it worked, or about places not shown.
- Heat right now is an estimateLive model data, refreshed every 30 minutes. It is not an official warning: for alerts, follow the national weather service linked on each city.
- Missing a step?Plans and rules are added each month. If one is missing, please tell us.
Heatwaves that shaped Asia · Worked plans · Cities · Countries